
SteamCharts Wanderburg Player Count: Scope, Peaks, and Refresh Timing
- Reviewed
- Scope
- Dated evidence; no installed-build testing
The captured SteamCharts Wanderburg page showed 415 players currently playing, a 1,007-player 24-hour peak, and a 10,550-player all-time peak. Those values were recorded on October 9, 2026 at 00:47:59 UTC. They are a dated snapshot, not permanent live numbers.
SteamCharts measures concurrent activity: how many Steam users appear to be running the game at the same time. It does not show total owners, copies sold, unique daily players, review activity, leaderboard position, or the number of people who have ever launched Wanderburg. The official Steam listing identifies Wanderburg as a single-player game, so its concurrent count should not be interpreted as a multiplayer population or matchmaking-health metric.
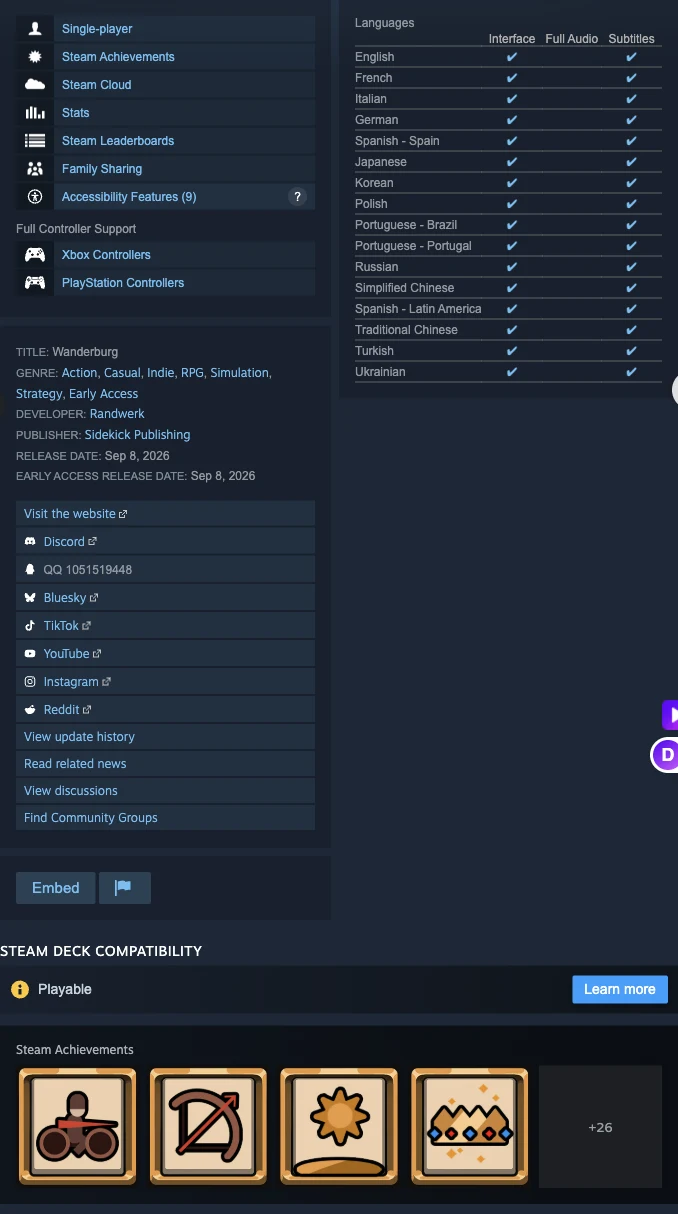
Steam Leaderboards record scores; concurrent player charts measure another quantity.
Wanderburg player-count snapshot
| Metric | Captured value | Practical meaning |
|---|---|---|
| Playing | 415 | The concurrent count displayed when the page was captured |
| 24-hour peak | 1,007 | The highest displayed concurrent count during the preceding daily window |
| All-time peak | 10,550 | The highest concurrent count in the recorded SteamCharts history |
| Last 30 Days average | 2,310.49 | The mean concurrent-player value shown for the rolling period |
| Last 30 Days gain | -625.2 | The displayed change from the preceding comparison period |
| Last 30 Days percentage gain | -21.30% | The displayed relative change in average players |
| Last 30 Days peak | 10,550 | The highest concurrent value inside that displayed period |
| September 2026 average | 2,935.74 | The average shown for the September calendar row |
| September 2026 peak | 10,550 | The highest concurrent value shown for September |
The first three values answer different questions. “Playing” is one moment, the 24-hour peak is a recent high point, and the all-time peak is the historical ceiling. Comparing them as if they described the same interval produces misleading conclusions.
How to read each concurrent-player metric
Current players describe one moment
The displayed 415 playing value is useful only with its capture time. Player activity changes throughout the day as regions enter and leave their normal gaming hours. A current count may therefore rise or fall substantially without indicating a lasting change in interest.
Use this number when you need a time-specific activity check. Record the value, date, time, and timezone together. If you return later, treat the new number as another observation rather than silently replacing the old one.
A single current reading should not be compared directly with an average. The current figure represents one point; an average combines many points across a longer interval. A current value below the monthly average may simply have been captured during a quieter hour.
The 24-hour peak shows the recent daily high
The 1,007 24-hour peak is more useful than the current value when you want to understand the highest recent activity. It reduces the effect of checking during one unusually quiet hour, but it still describes only a short window.
Compare 24-hour peaks taken at similar times on different days. Because the window moves forward continuously, two checks made several hours apart may include different high-activity periods. The number can change even when the underlying audience is stable.
The all-time peak is a ceiling, not a normal population
The captured 10,550 all-time peak records the largest concurrent audience displayed in the available history. Wanderburg entered Steam Early Access on September 8, 2026, and the September row contains the same 10,550 peak. That places the recorded high inside the launch month, but it does not establish the exact hour or explain what caused it.
Do not use 10,550 as an estimate of a typical day. Launch attention often concentrates many players into a short period, while an average describes sustained activity across the whole measurement interval.
Monthly averages show sustained activity
SteamCharts displayed a September 2026 average of 2,935.74 players and a Last 30 Days average of 2,310.49. The latter row also showed a -625.2 gain and -21.30% change.
The useful conclusion is narrow: the displayed rolling-period average was lower than the comparison represented by SteamCharts. It does not prove why activity changed, and it does not predict the next month. Early Access updates, launch-week concentration, weekdays, weekends, time zones, streaming exposure, and ordinary audience turnover can overlap.
The two peak fields remained at 10,550 while the average declined. This illustrates why peaks and averages must be read together. The historical high remained in the window, but ordinary concurrent activity across the period was lower than the launch-month average.
What the numbers include and exclude
SteamCharts describes its service as an ongoing analysis of Steam concurrent players. The relevant identifier is Wanderburg’s Steam App ID, 3624140, which helps distinguish the game from similarly named products. The figures concern observable Steam activity associated with that app.
These counts should not be converted into any of the following:
- Sales or owners: One person can own a game without running it during the measured period. The official launch recap said more than 150,000 people had “picked up” Wanderburg in its first three days, but that statement is not a concurrent-player count.
- Unique players: A concurrent average does not reveal how many distinct accounts participated during a day or month.
- Playtime: A player appearing in concurrent data does not disclose how long that individual session lasted.
- Review totals or sentiment: Store reviews measure submitted feedback, not simultaneous play.
- Leaderboard performance: Wanderburg’s Steam features include leaderboards, but score placement and concurrent activity are separate datasets.
- Multiplayer demand: The store page explicitly lists single-player. Concurrent activity therefore does not demonstrate an active multiplayer pool.
- Cross-platform activity: The captured figures are Steam-focused and should not be expanded into an unsupported total for other platforms.
The captured Sensor Tower page presented “Max Daily Concurrent Players” as an enterprise metric but did not expose a usable Wanderburg value. Another player-count service stated that its data updates every hour, yet its captured Wanderburg page also displayed no numerical count. Neither blank result should be used to manufacture a comparison with the SteamCharts snapshot.
Official updates and dated player observations
Official announcements are useful for marking events on a timeline, but they do not replace the third-party concurrency series. On September 11, the developers reported that Wanderburg had peaked at 9.9K players online at once the previous day. This was a rounded, dated official observation published shortly after launch.
SteamCharts later displayed an all-time peak of 10,550. These figures do not need to be forced into a conflict. The official post described an earlier point in time and used a rounded value; the later SteamCharts capture summarized a broader recorded history with a more precise-looking figure. Keep both attached to their dates and wording.
The official timeline also provides legitimate chart annotations:
- Wanderburg entered Early Access on September 8, 2026.
- Hotfixes were announced on September 9, 10, 11, 12, 19, and 21.
- Hotfix 0.9.14 was the latest regular update shown in the Steam listing checked on October 9, dated September 21.
- The Early Access roadmap announcement was dated September 30.
These events can help organize a comparison, but proximity is not proof of causation. If activity changes after a hotfix, the chart alone cannot show whether the patch, the weekday, regional play hours, launch decay, or another factor produced the movement.
Refresh timing and a repeatable checking method
The captured SteamCharts page did not state a guaranteed refresh interval. Do not label its current-player figure as second-by-second, minute-by-minute, or hourly without an explicit service statement. The reliable timing fact is the October 9 page-capture timestamp attached to the observation.
Use this process for consistent checks:
- Confirm the correct app. Check that the page is for Wanderburg and App ID 3624140.
- Record the observation time. Save the full date, clock time, and timezone beside the “playing” value.
- Copy all three headline metrics. Record current players, 24-hour peak, and all-time peak together so that later comparisons retain context.
- Copy the relevant period row. For short-term direction, keep the Last 30 Days average, gain, percentage change, and peak as one set.
- Compare like with like. Current counts should be compared at similar hours; 24-hour peaks with other 24-hour peaks; monthly averages with completed or equivalently defined periods.
- Annotate official events separately. Add release and update dates beside the series, but describe any apparent relationship as timing rather than demonstrated cause.
- Preserve old observations. A small log is more useful than repeatedly checking the page without retaining previous values.
A practical log can use six columns: observed at, current players, 24-hour peak, all-time peak, period average, and official event note. Weekly checks at the same weekday and UTC time reduce one source of noise. For launch-period monitoring, daily checks can be useful, but they should still be made on a consistent schedule.
Do not expect two services to update simultaneously. The separate service that explicitly states an hourly schedule may display a value from a different collection time than SteamCharts. A mismatch between two pages is not automatically an error unless their definitions, timestamps, app scope, and intervals also match.
Choosing the right comparison
Use the metric that matches the decision you are making:
- To describe activity at a specific recorded moment, use 415 playing, always with the October 9 capture timestamp.
- To describe the strongest recent daily activity in that snapshot, use the 1,007 24-hour peak.
- To describe the recorded launch-era ceiling, use the 10,550 all-time peak.
- To compare sustained activity, use the 2,310.49 Last 30 Days average against a comparable average, not against a momentary count.
- To describe direction, report the displayed -625.2 and -21.30% together with the period label and capture date.
Avoid reducing all of these to “Wanderburg has 415 players.” That sentence loses the timestamp, ignores the higher daily peak, and can quickly become stale. A precise version is: “At the October 9, 2026 SteamCharts capture, Wanderburg showed 415 concurrent players, a 1,007 24-hour peak, and a 10,550 all-time peak.”
Practical next checks
For the next useful observation, revisit the same App ID at the same UTC time, record a new complete metric set, and compare it with the saved October 9 snapshot. If the current count changes but the 24-hour peak and rolling average remain similar, treat the movement as short-term variation. If comparable averages move across successive periods, describe the direction without assigning a cause until the timing can be evaluated against dated official updates.
Keep leaderboard scores, review totals, ownership claims, and update notes in separate fields. That separation turns a changing public counter into a usable activity record without overstating what concurrent-player data can prove.